

Stats & Reports
Charts for consumption, costs and distance, plus reports of your car's history.
- Fuel, costs and distance statistics
- Monthly costs and category breakdowns
- Cost per mile or kilometre
- Reports from your fuel and cost logs, as PDF (or text on Android)*
- CSV import and export
Available onAndroidiOS
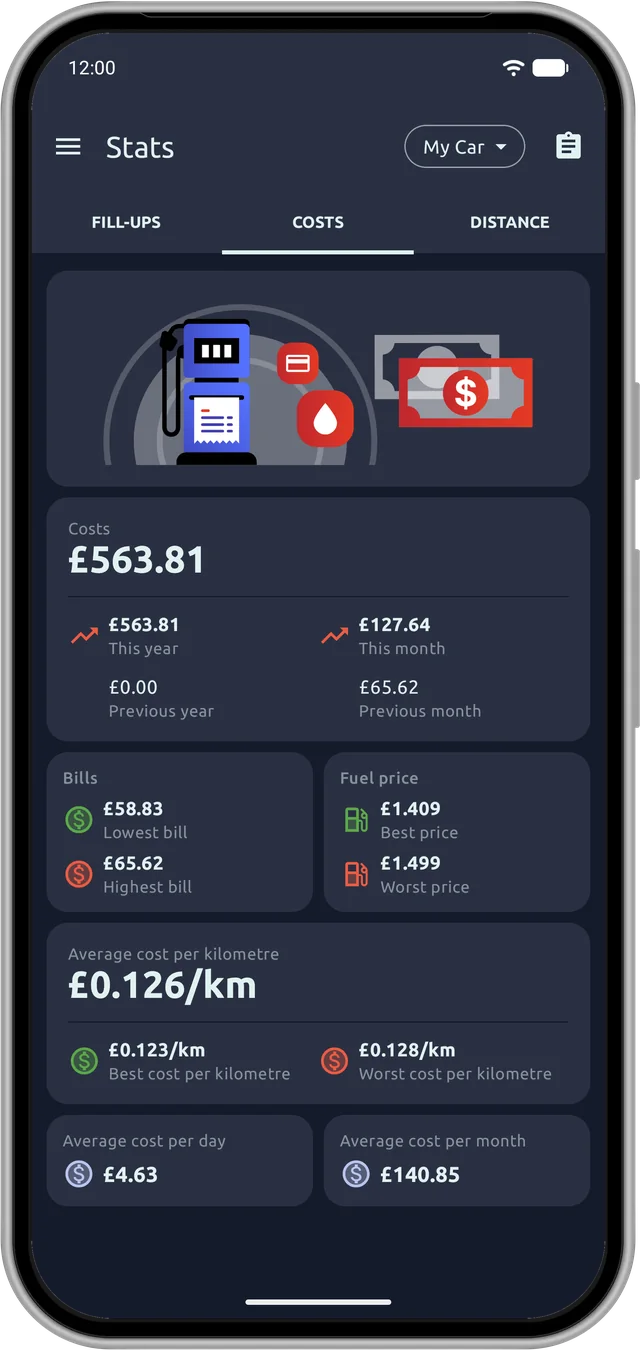
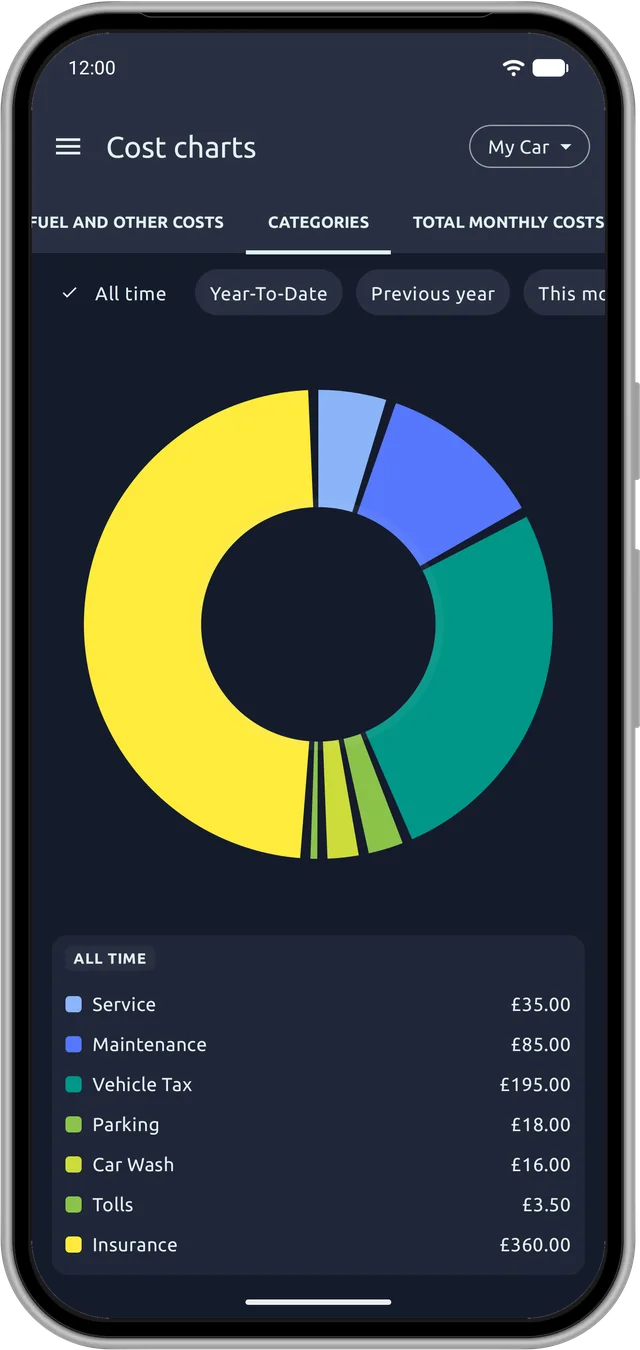
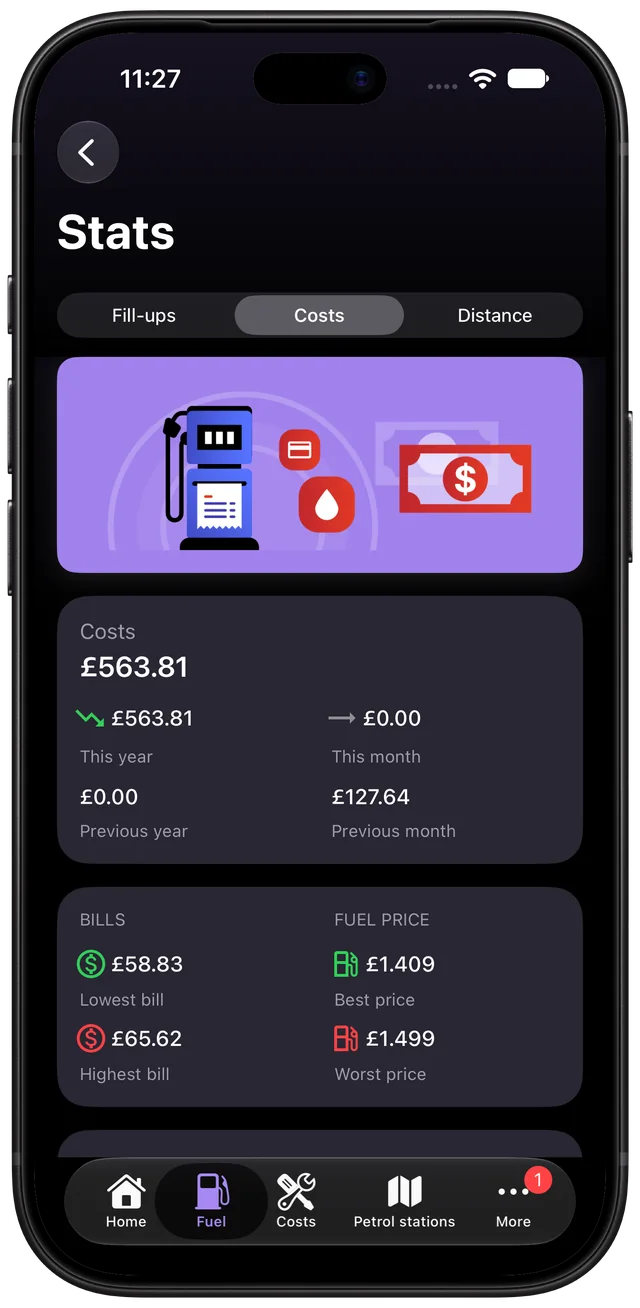
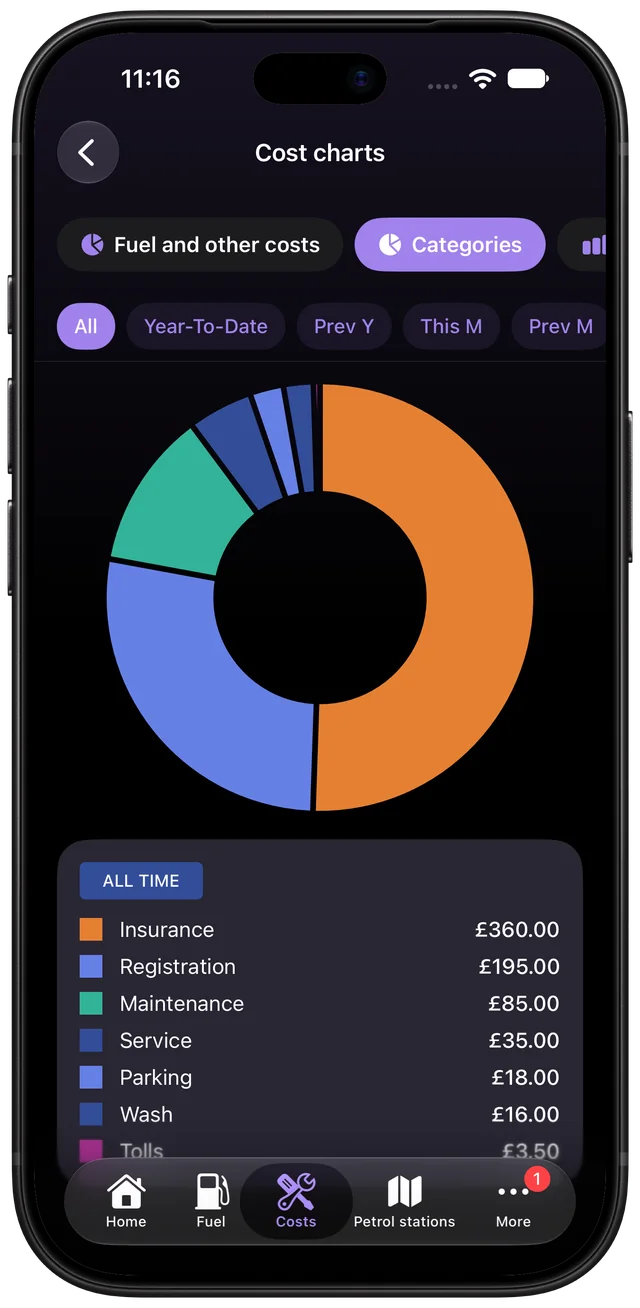
One Fuelio user said the stats page is useful "for showing just how expensive cars really are to run". That's the idea.
Three views of your car
- Fill-ups: average, best and worst fuel economy, smallest and largest fill-up, total fuel.
- Costs: this month, this year and previous periods, lowest and highest bills, cost per mile or kilometre.
- Distance: average per day and per month, and the total you've driven.
A separate cost screen adds totals by category, with and without fuel. Charts show consumption, prices, monthly costs and distance over time.
The guide on cost per mile explains how to use these numbers to judge what your car really costs.
Reports
Create a report in a few taps and export it as a PDF, or as text on Android. A Seller's report, a Custom report where you pick the categories and details (with or without prices) and a Cost of Ownership report are ready to use when you sell the car or file an expense claim. Annual Summary, Fuel Efficiency and Maintenance History reports* go deeper. For mileage claims, Android has a Tax/Mileage report* and iPhone a Trip Log report*.
Your data, your backups
Fuelio stores your data on your phone, with no account. You can import and export CSV files at any time. On Android, back up to Google Drive or Dropbox; on iPhone, use iCloud Drive. How backups work.
* Part of Fuelio Premium.


